


Sunday Sept. 17th Weekly Outlook
My Weekly Plan

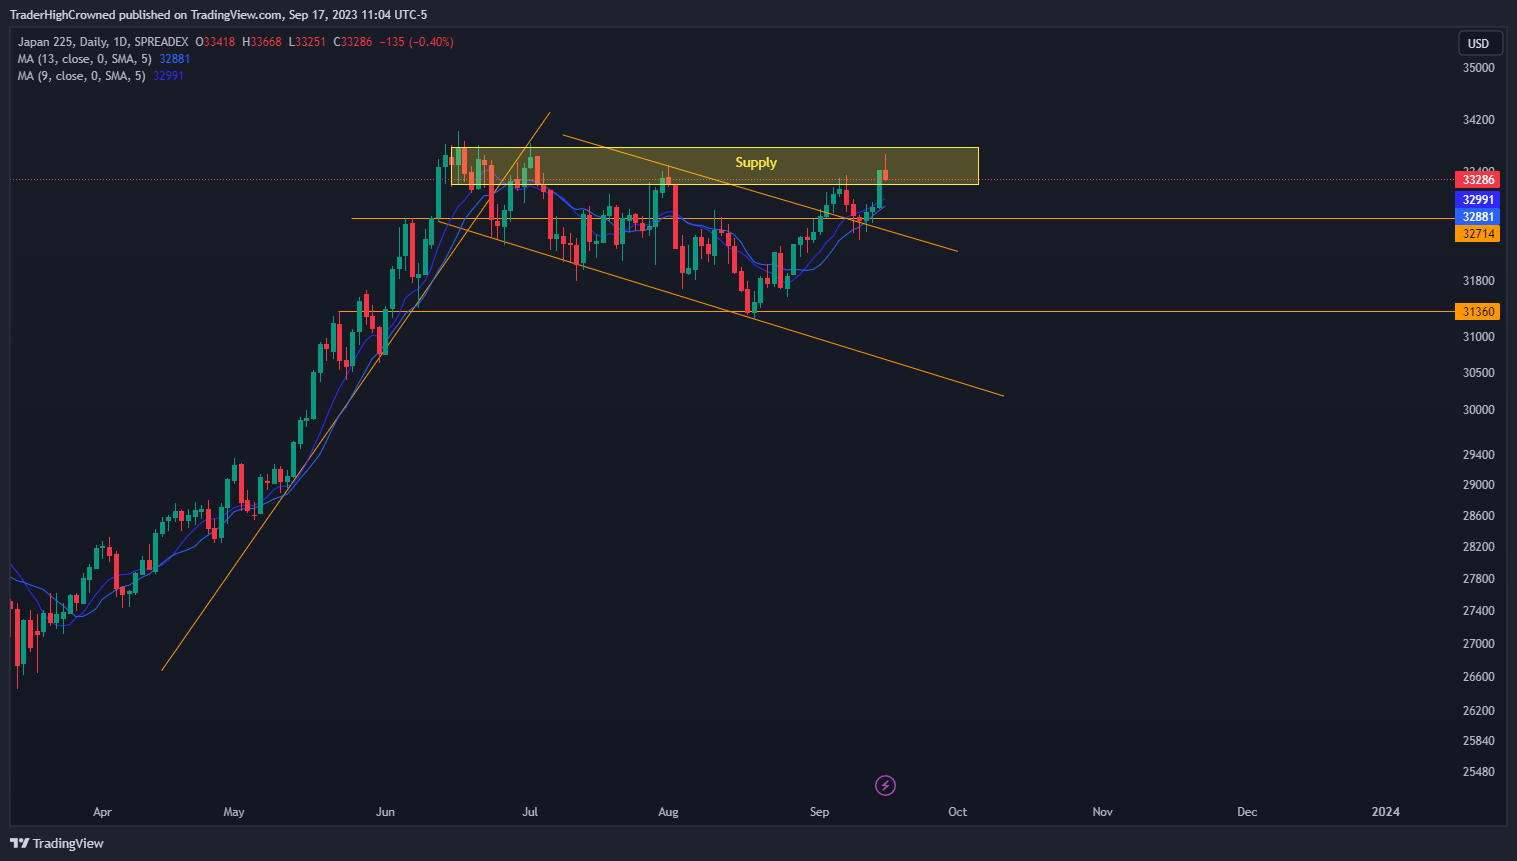
$NIKKEI 1 Day Chart
In my opinion, this is the most important chart for equities. The first reader of global liquidity/risk-on/risk-off. We continue to range(probably distribution) and reject the supply zone. Friday’s wick can be a sign of a major reversal coming. Bears need to break ~31400 with a gap down below the level to see a markdown.