


Sunday Sept. 24th Weekly Outlook
My Weekly Plan

Review:
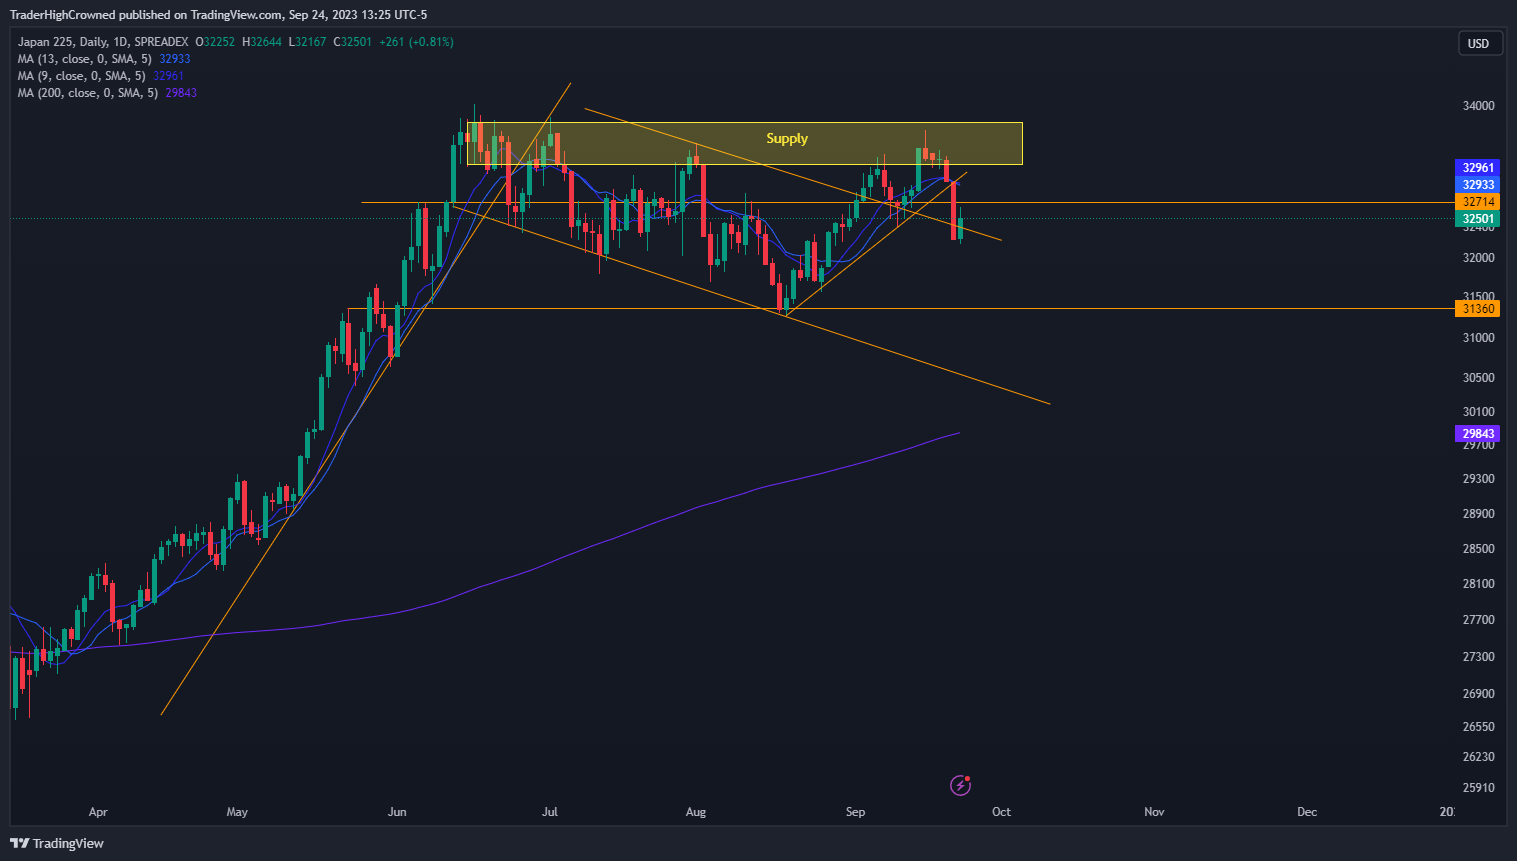
$NIKKEI 1 Day Chart
We are back into the range of 32700-31400. The false breakout of the Bull Flag has materialized. Reminder, I use NIKKEI as a global gauge of liquidity, it smells it out first. Either we chop around before heading down to 31400, or this is the sell that pushes us to a markdown below 31400.
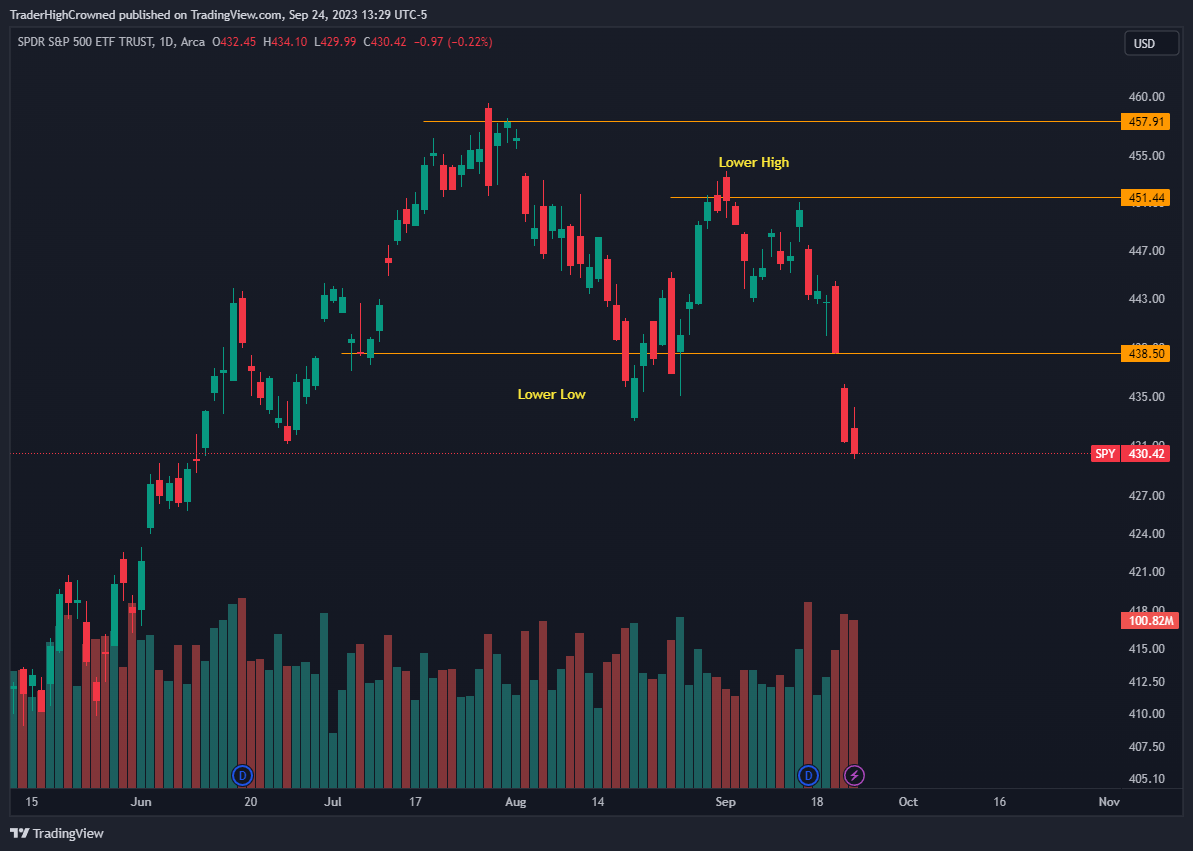
SPY 0.00%↑ 1 Day Chart
Bears defended the Lower High and now have a new lower low. Bearish Market Structure remains intact.
More charts will be posted on my twitter today for free.